Efficient manufacturing starts with choosing the right production strategy at the right scale. This guide helps you compare different manufacturing options by breaking down the cost per part for various lot sizes. You'll discover exactly when each production method becomes most cost-effective, enabling you to make informed decisions that optimize both your budget and your output.
To see and use the Break-Even Chart, follow the steps below:
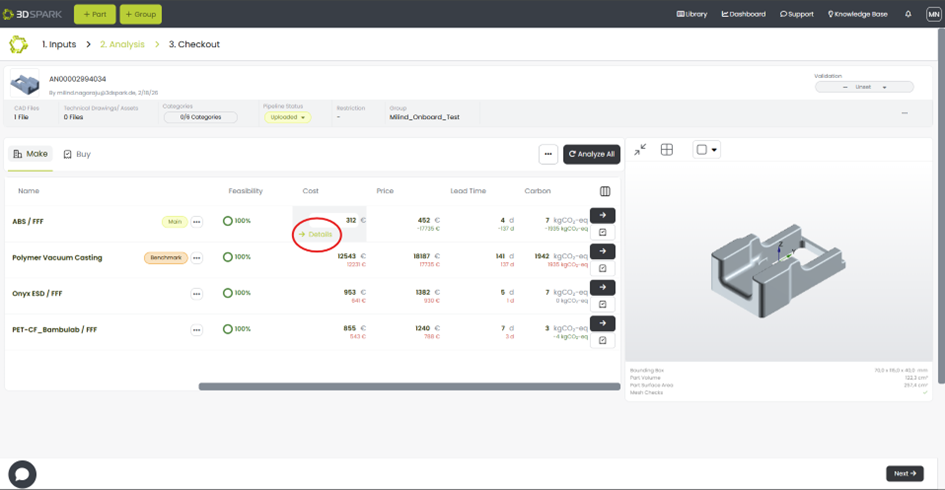
- Evaluate all the production options by clicking “Analyze All” button.
- After the analyzing is done, go to the cost details of the interested production option.
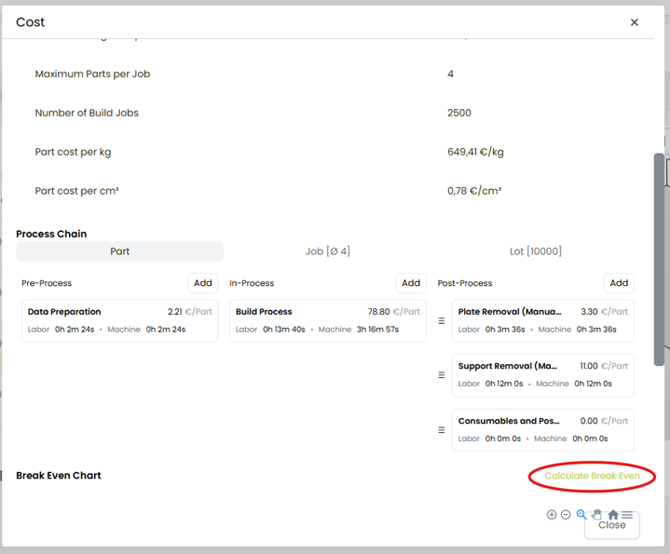
- Scroll down in the cost details menu to click on “Calculate Break Even” to generate the chart.
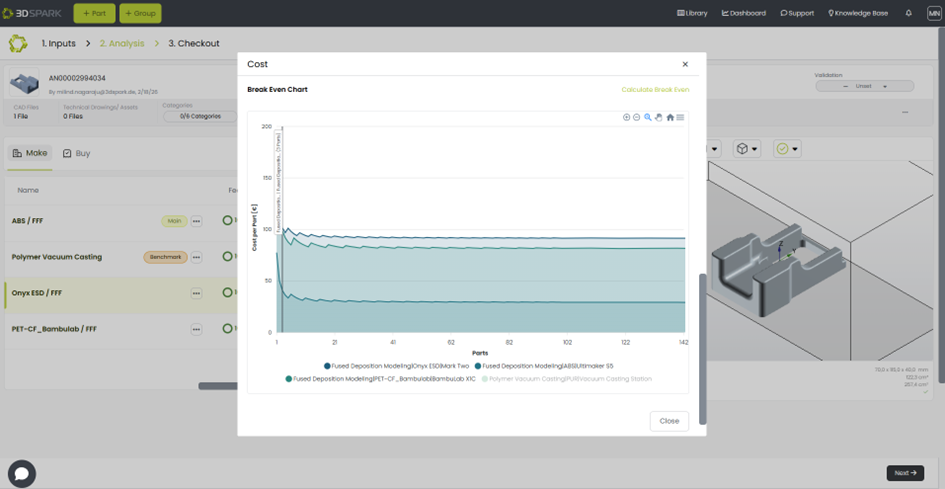
- Now you can view the chart. You can also hide individual production options by clicking on their name. To view them again, click on the name once more.